Concepts
This page covers the core concepts you need to build dashboards in Insights: dashboards, charts, metrics, and dimensions.
Dashboard
A dashboard is a collection of charts that present your data visually. You can create multiple dashboards for different audiences or purposes.
Dashboards can also include display components such as containers, text blocks, and dividers to add structure and descriptive text.
You can also add filter groups to a dashboard or container to let users interactively filter data without editing individual charts.
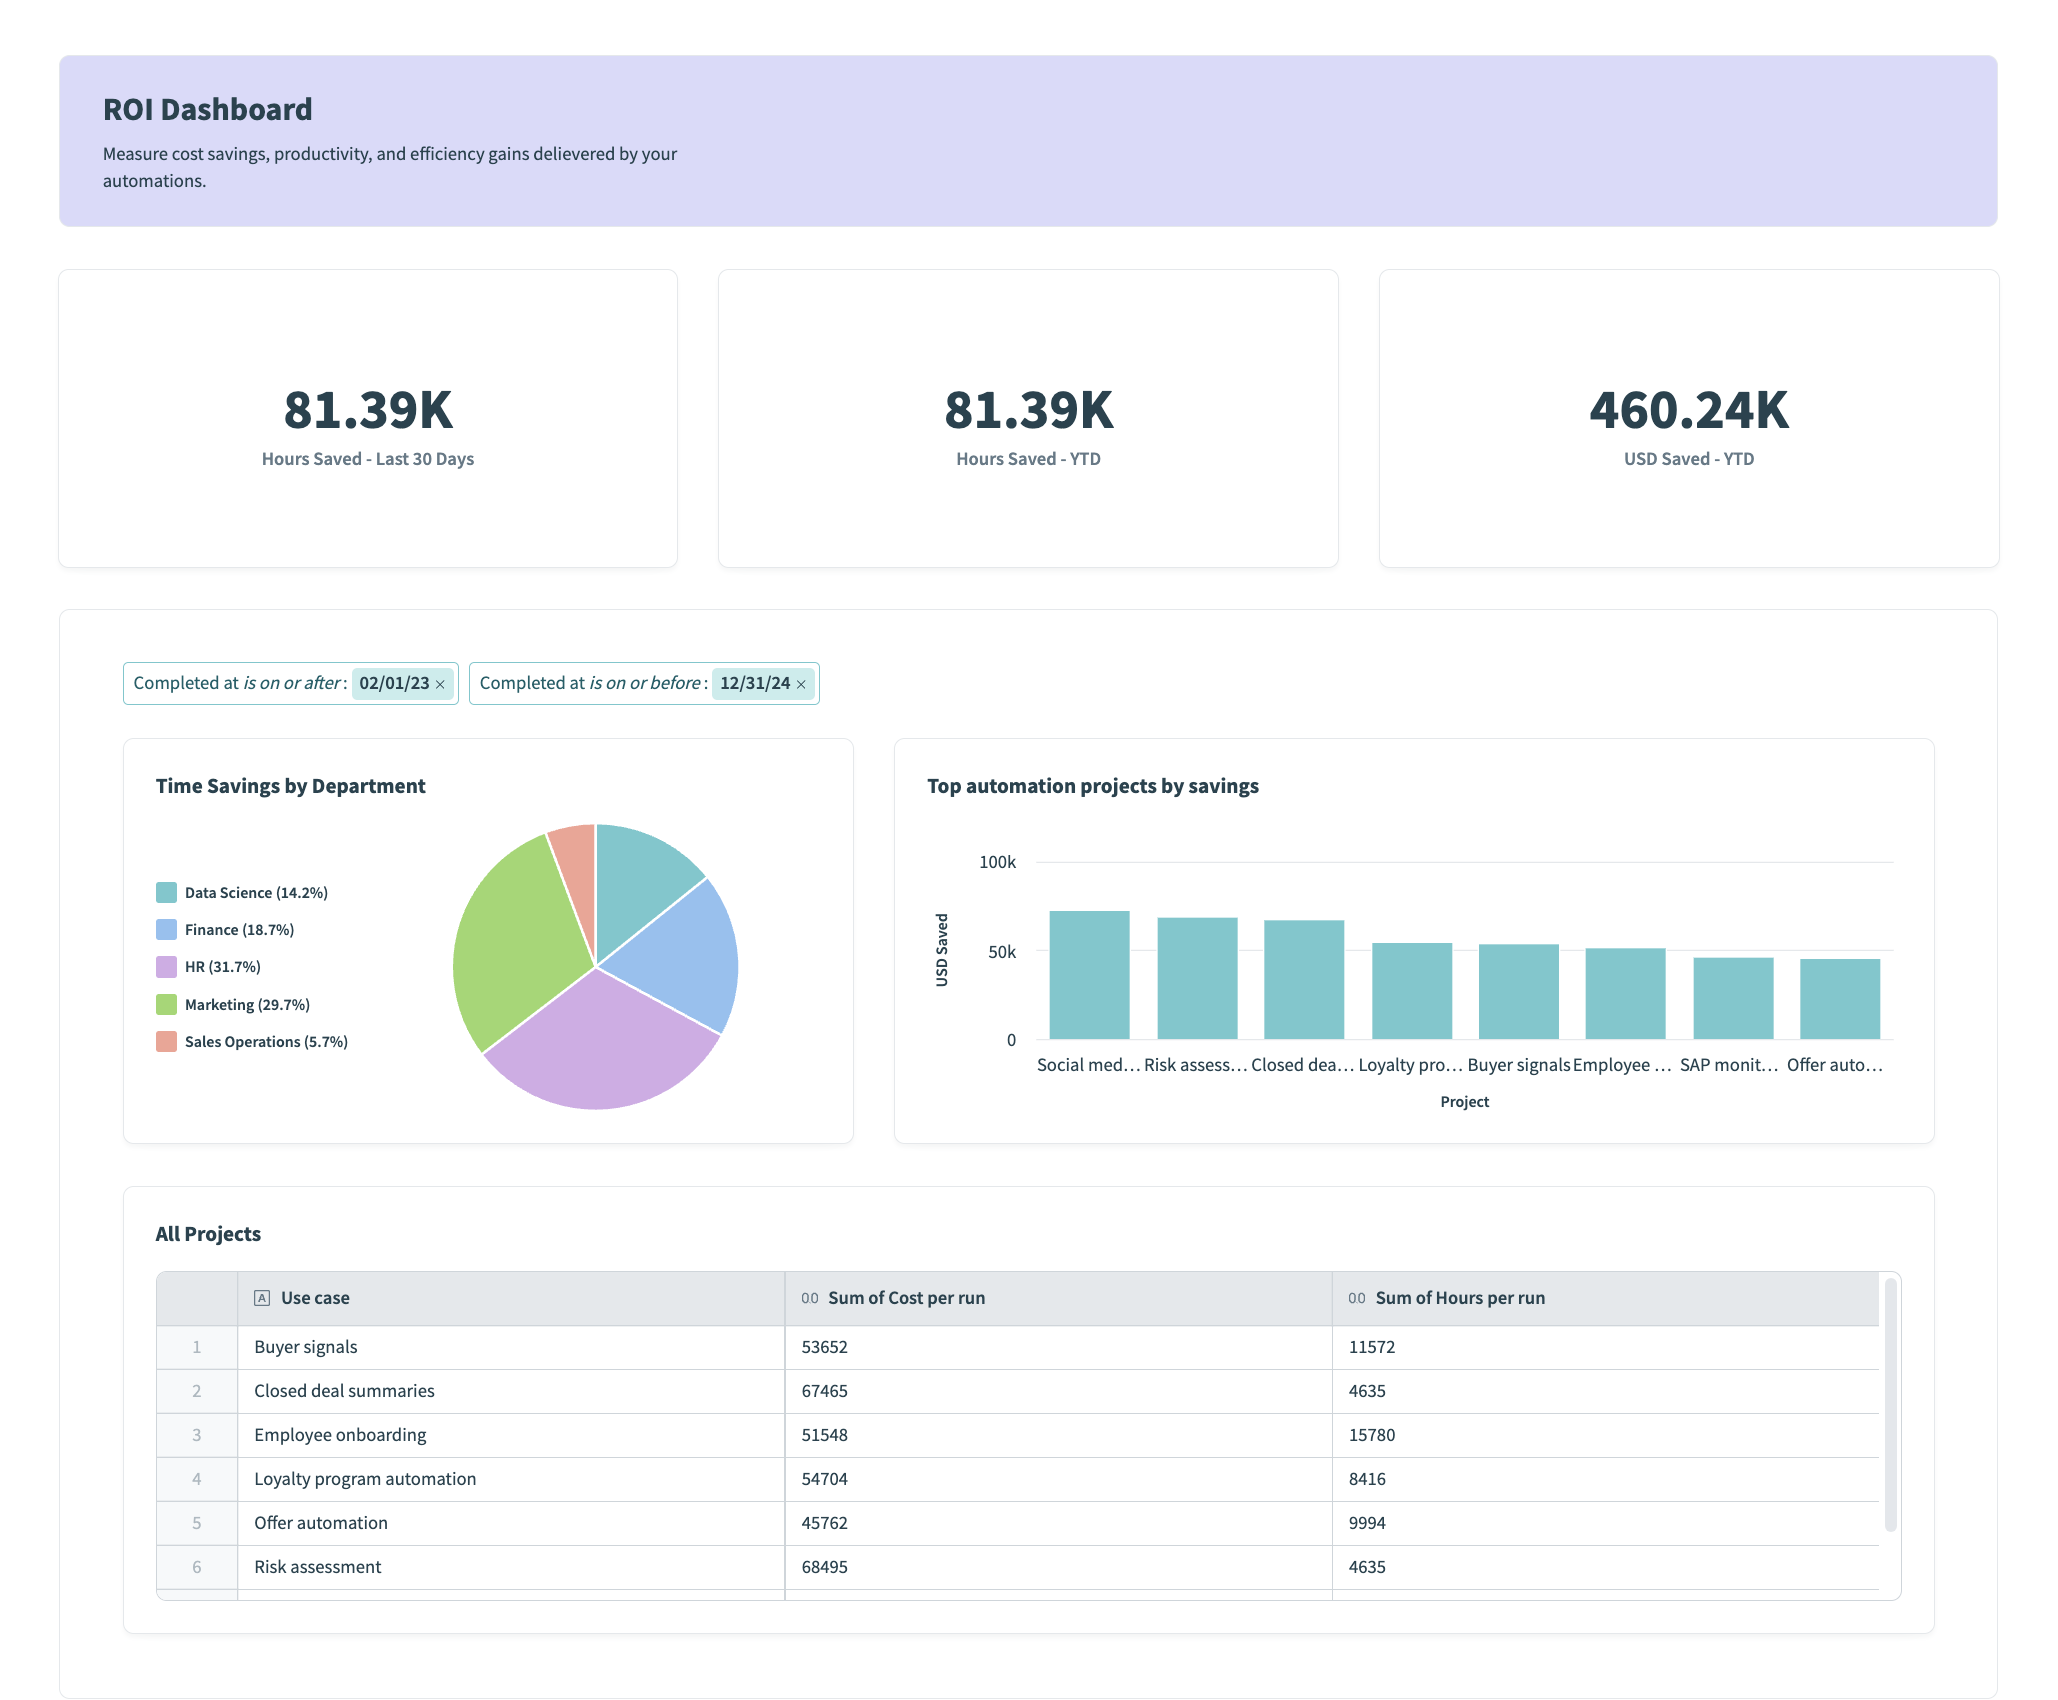 An Insights dashboard combining KPI charts, a pie chart, a bar chart, and a table
Chart
A chart displays your data as a table, graph, or other visualization. You configure each chart in the chart editor, where it queries a data source and displays the results as one of several chart types.
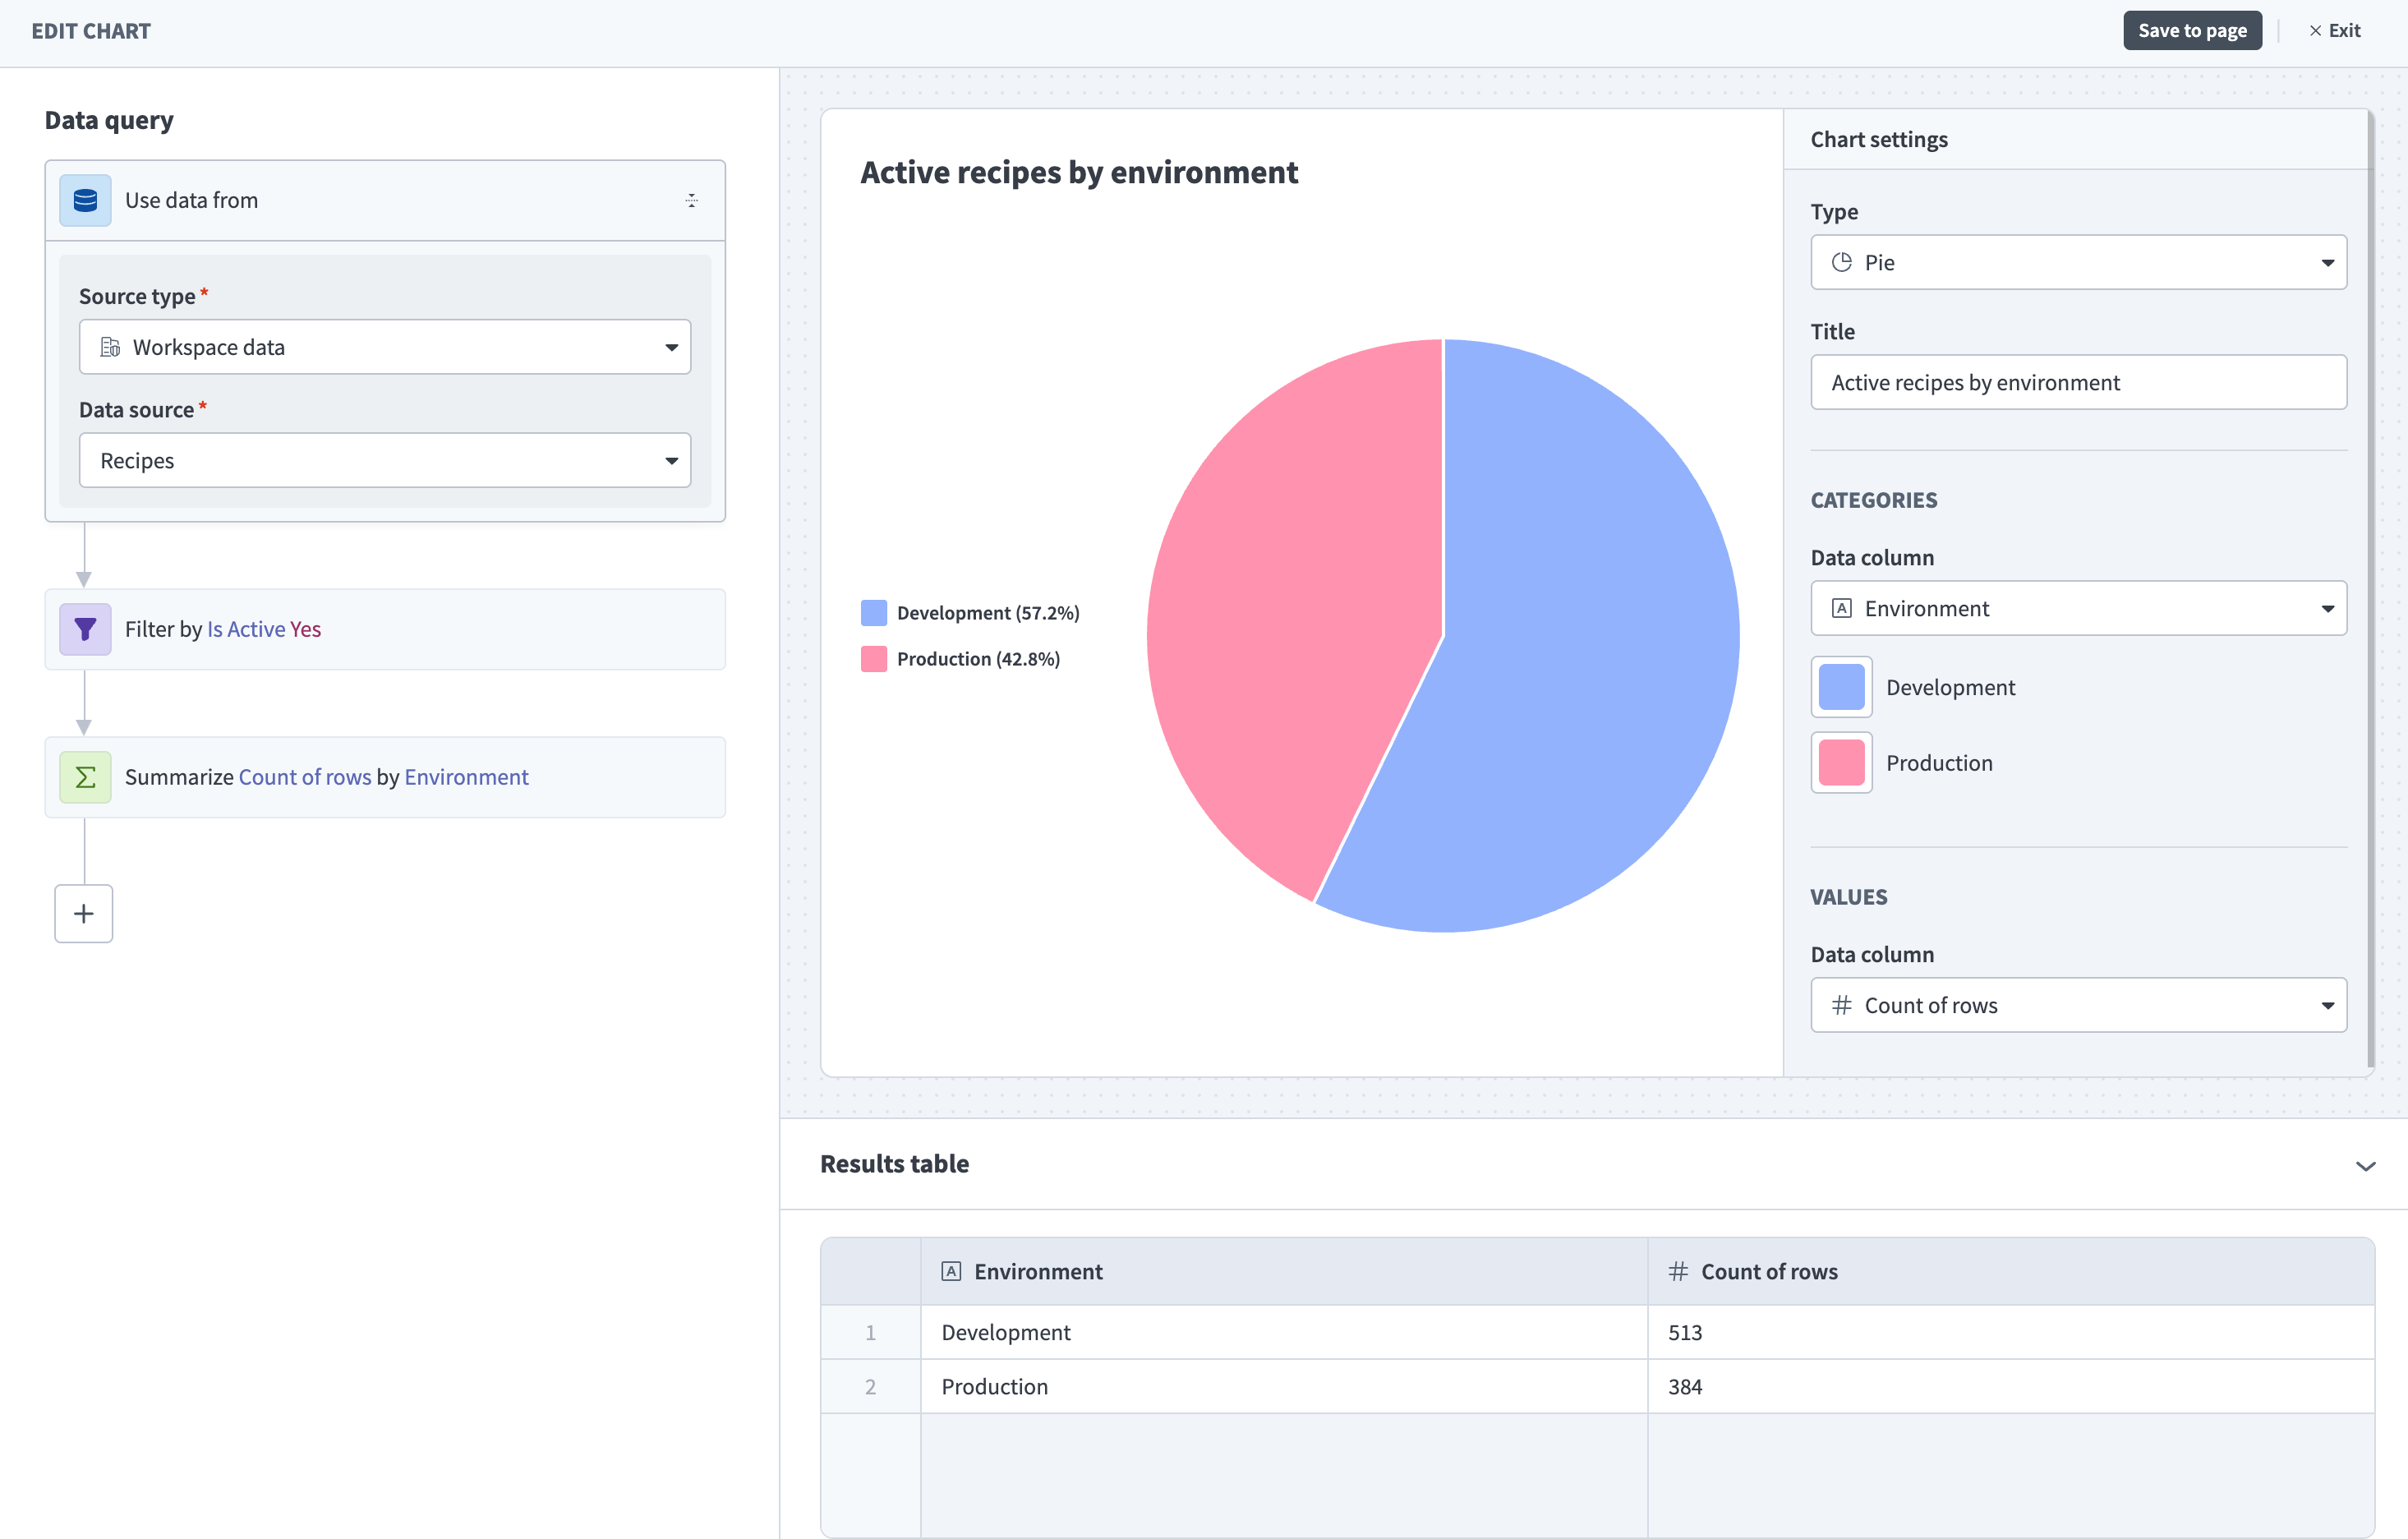 The chart editor
 offers two ways to define what your chart displays: The report builder (private beta) and the query builder.
| Report builder | Query builder | |
|---|---|---|
| Best for | Most charts, built quickly from prebuilt metrics and dimensions. | Complex transformations, built step by step with query components such as Filter, Summarize, and Sort. |
| Add to a dashboard | Drag a chart type, such as Bar, Pie, or KPI. | Drag the Chart component. This is named Chart (Custom Query) if you have report builder access. |
| Cross-workspace data | Aggregates usage metrics across child workspaces when you build in a parent workspace. | Current workspace only. |
Metric and dimension
A metric is the value your chart measures, such as number of jobs or money saved. A dimension is the category your chart uses to group that data, such as environment or project.
Metrics and dimensions both come from a data source, which is the dataset your chart queries. You can apply filters to narrow the data your chart displays.
For example, you can measure the number of successful and failed jobs (metric) grouped by environment (dimension) to understand how integrations are performing across environments.
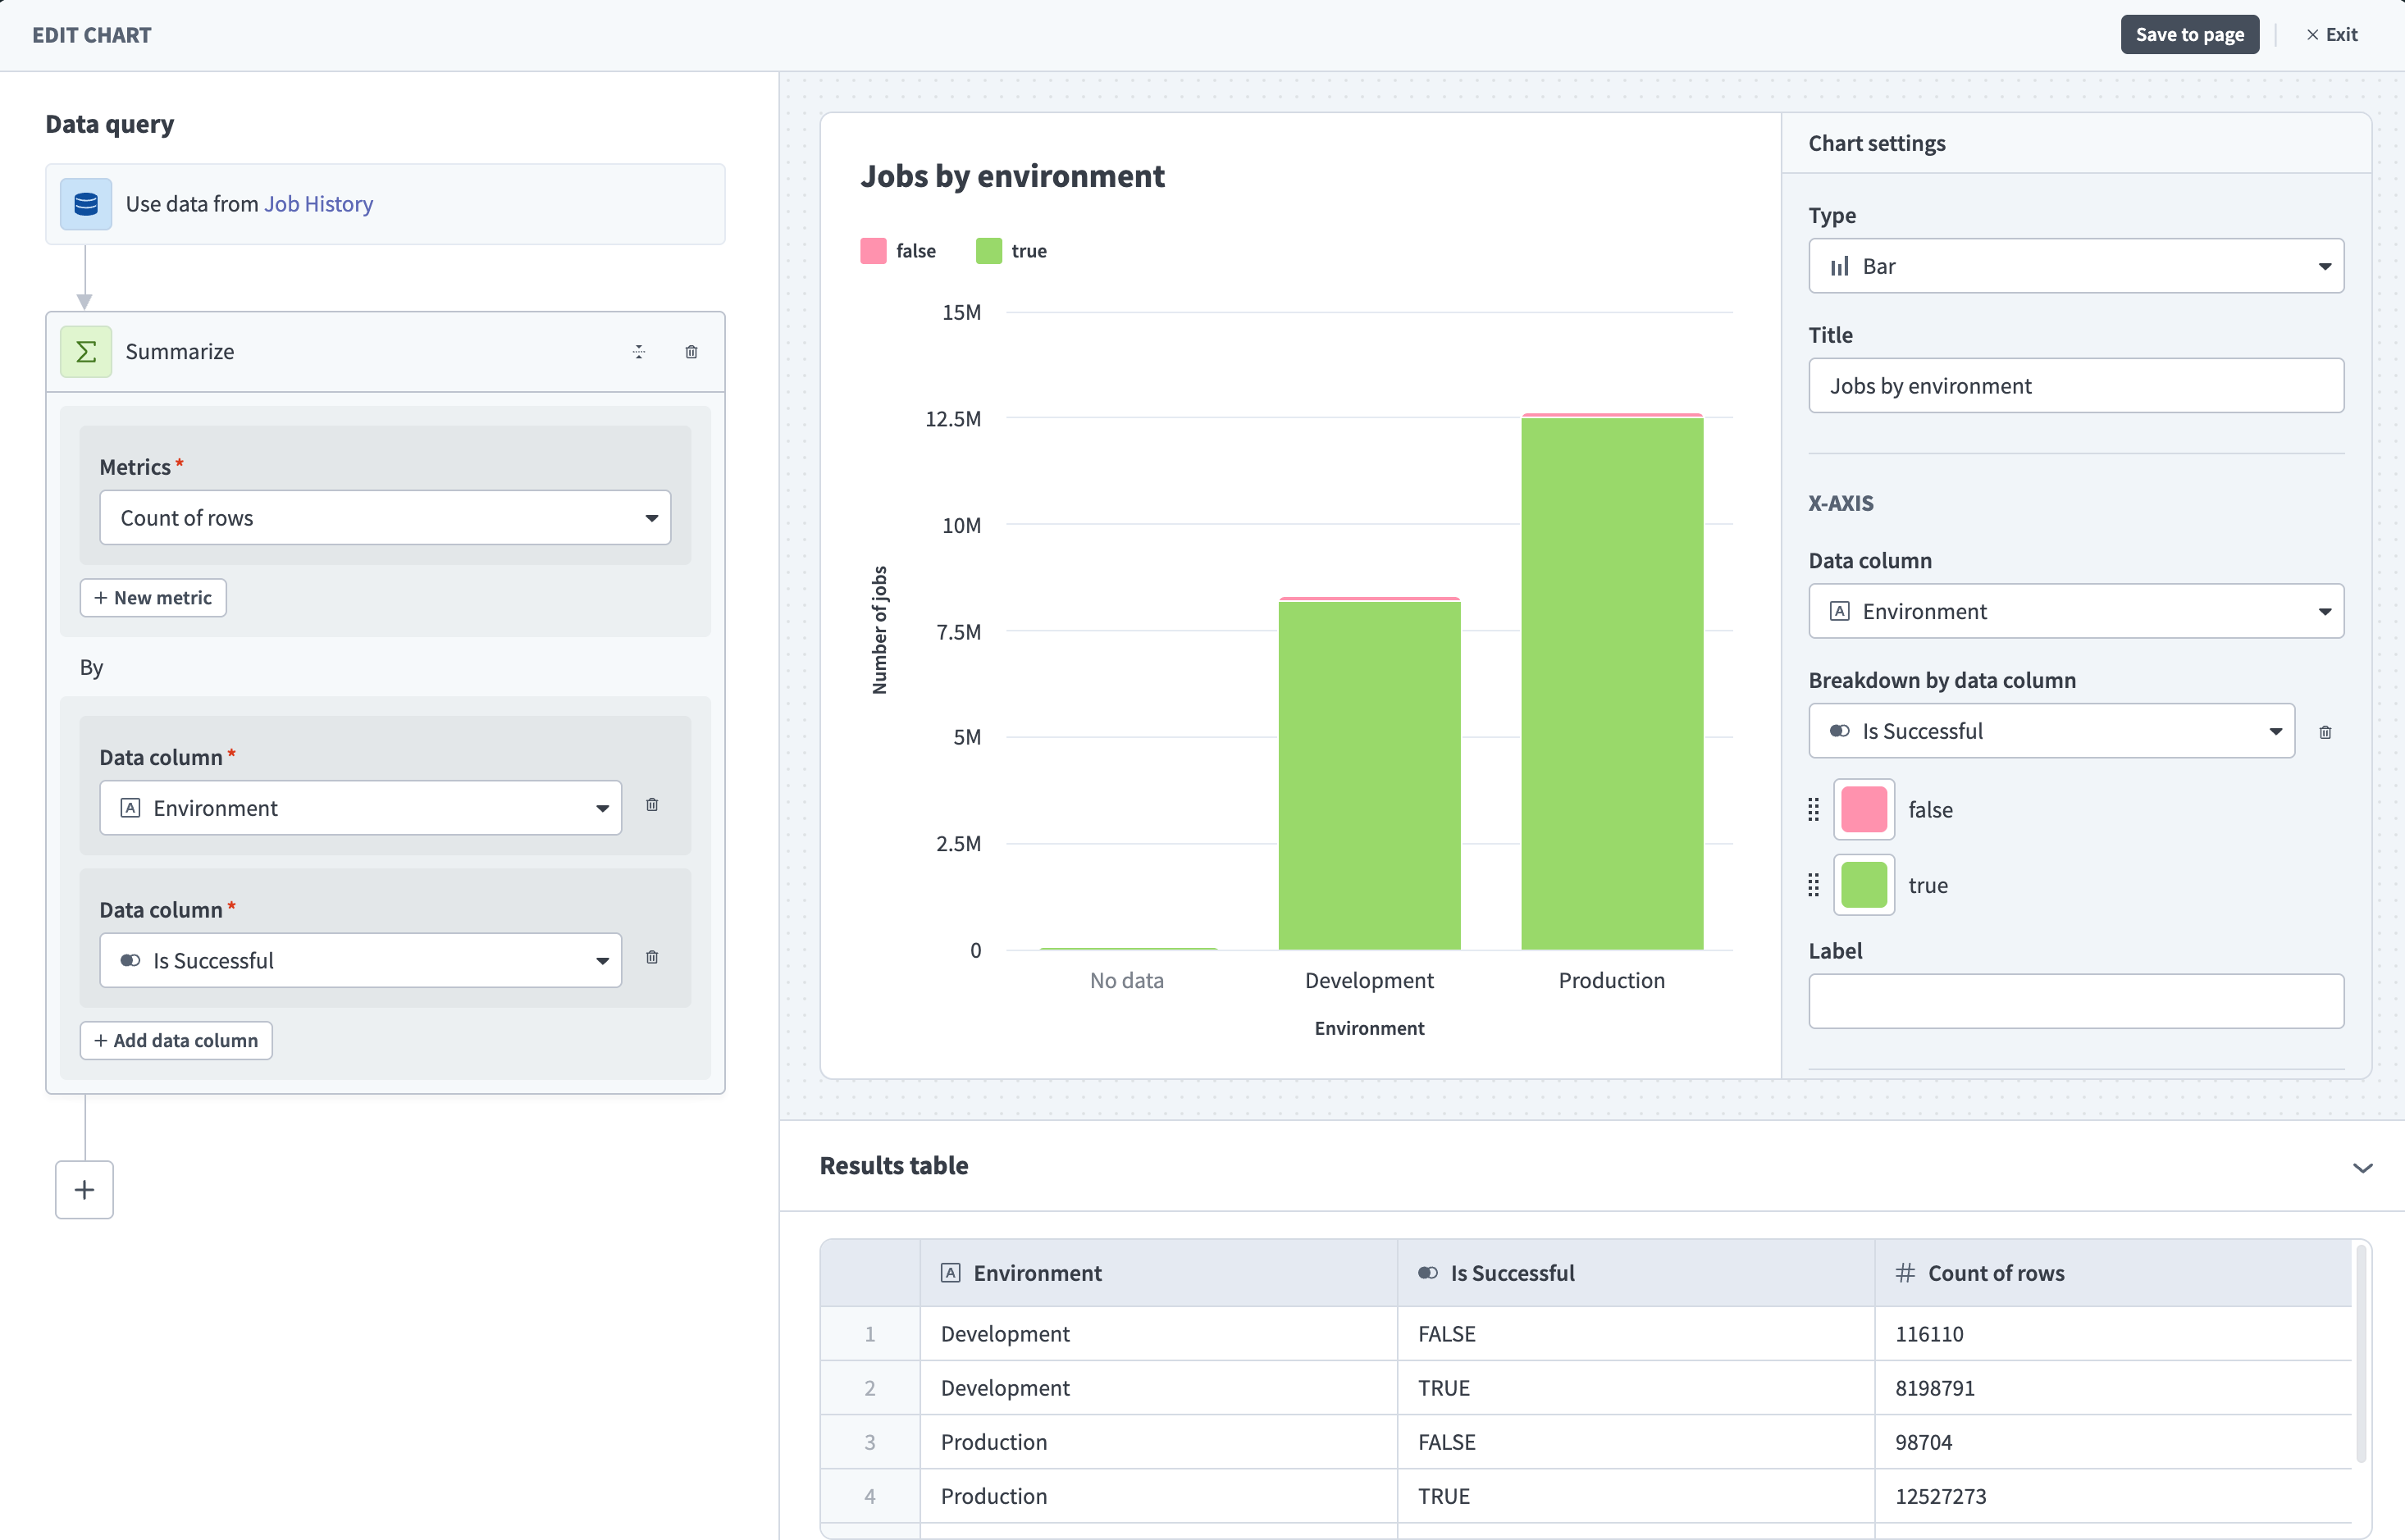 A chart configured with job count (metric) broken down by success and grouped by environment (dimension)
Refer to Build your first dashboard to start building, or Navigate Insights for a full overview of the interface.
Last updated: